Time series analysis

I use historical data from Yahoo! Finance with yfinance of stocks, indices, and stock market commodities, such as the price of gold, the MSCI World index, and the USD EUR conversion rates, and multiple selected stocks, and train an artificial intelligence, deep learning model based on long short-term memory (LSTM) networks to predict future development of prices with python, Keras, TensorFlow, and scikit-learn. The prices of the stock market traded items form naturally a multivariate time series. For any point in time, a time window of multiple past data points is used to predict the data points of a future time window (of possibly different length). The image above depicts only Tesla prices although the underlying model was trained with seven commodities. It also shows three regions: Training, Validation, and Forecast.
- Training
- During training, the model learns exactly which input values result in which output values, i.e., it is supervised learning. It was performed in multiple epochs, and in each epoch the training data was shuffled and randomly split into 80% epoch-training data and 20% epoch-validation data to monitor and prevent overfitting.
- Validation
- In the validation step, the trained model is applied to the known real-world data and predicts a time window of future prices. As the model has not been trained with these inputs and outputs, its true performance can be measured in this region.
- Forecast
- Forecasting is similar to validation, but the key difference is that predicted data is recursively fed into the model as input data so that longer horizons can be predicted.
Comparison
The analysis and prediction above is compared to two other algorithms.
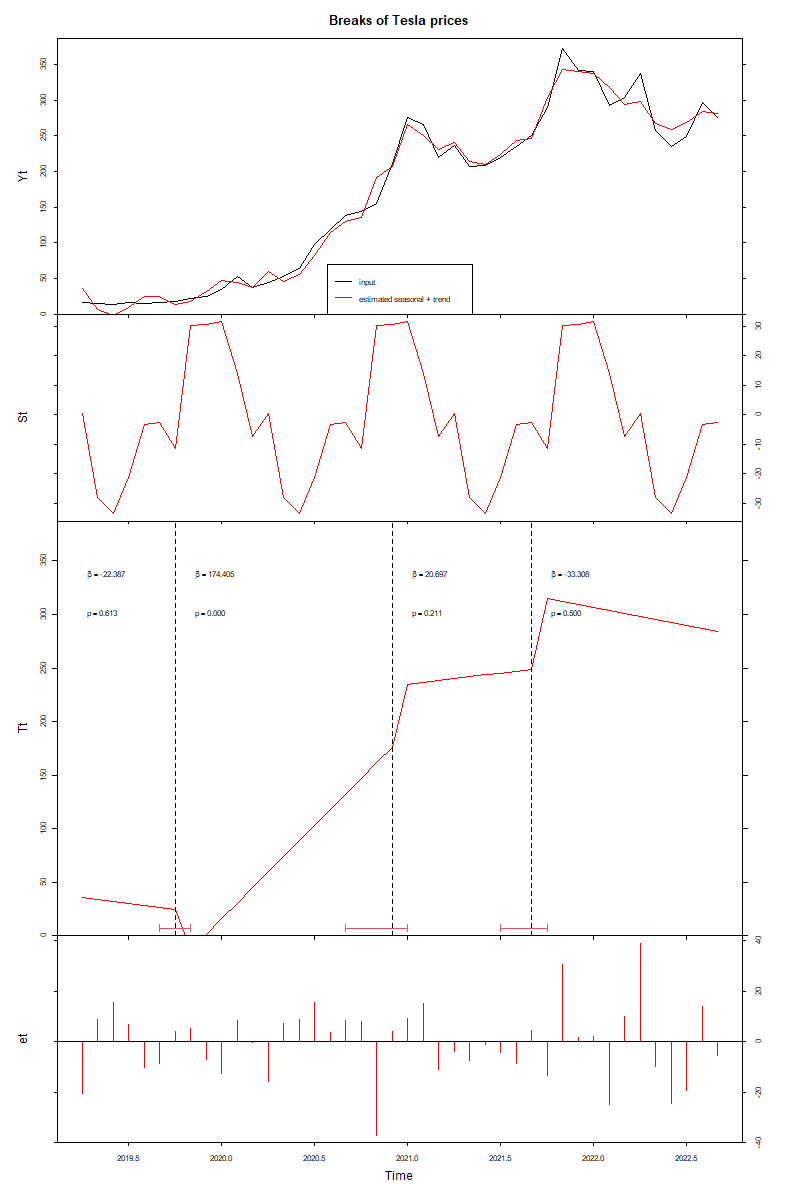
BFAST (Breaks For Additive Seasonal and Trend) is a time-series analysis method used to detect and model abrupt changes in trends and seasonality within a time series. It is available as python and R library. Further details are in the paper of Verbesselt et al. Detecting trend and seasonal changes in satellite image time series. The picture shows detected breaks and the decomposition of the time series in trend and seasonal parts.

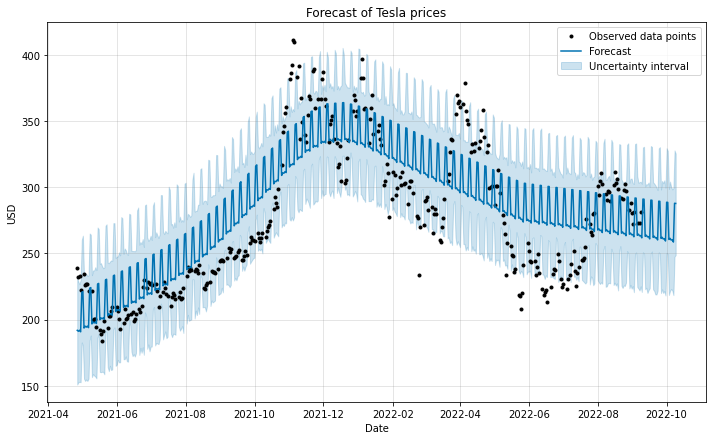
Prophet is a time-series forecasting tool developed by Facebook that models trend, seasonality, and holidays similar to a generalized additive model (GAM). It is available as python and R library. In the paper Forecasting at Scale, Taylor and Letham describe the methods further. The result of applying prophet is shown in the next image.

